Showing posts with label MSChart. Show all posts

17 April 2012

MS Chart Legend Properties and Hide Series Based on Condition

I have a MSChart that displays two series. The data is taken from a database. Sometimes I only want to display one of the series in my chart based on the condition. Follow the bellow steps to hide series.
                 Chart1.Series["Series Name"].Enabled = false; 


We can set Legends properties in code behind as shown bellow steps.
                Chart1.Legends["Default"].Title = "Chart";
                Chart1.Legends["Default"].LegendStyle = LegendStyle.Column;
                Chart1.Legends["Default"].Docking = LegendDocking.Right;
                Chart1.Legends["Default"].Alignment = StringAlignment.Center;
                Chart1.Legends["Default"].BackColor = System.Drawing.Color.Transparent;
                Chart1.Legends["Default"].IsTextAutoFit = false;
                Chart1.Legends["Default"].BorderColor = Color.Black;
                Chart1.Legends["Default"].BorderWidth = 2;
                Chart1.Legends["Default"].BorderDashStyle = ChartDashStyle.Solid;
                Chart1.Legends["Default"].Font = new Font("Arial", 10, FontStyle.Bold);
                Chart1.Legends["Default"].ForeColor = Color.Black;
                Chart1.Legends["Default"].IsEquallySpacedItems = true;


We can set Legends properties in Design 

<Legends>
     <asp:Legend Name="Legend1" Docking="Right" Title="Chart" ForeColor="Black" BorderColor="Black" BorderWidth="2"  BorderDashStyle="Solid" BackColor="Transparent" Font="Trebuchet MS, 8.25pt, style=Bold"  IsTextAutoFit="False">
     </asp:Legend>
</Legends>

06 February 2012

Chart Elements Overview

A chart consists of numerous elements, all of which are accessible via the Chart control API. The Chart control API is object-oriented, extensible and highly flexible. It also supports an unlimited number of key chart elements such as data series, data points in a series, chart areas, and so on.
The following figure illustrates the key elements that constitute a chart:
Description of Chart Elements
The following lists describes the major chart components:  

Axis Label
A label along an axis.  

Axis Title
The title of an axis.

Chart Area
The chart picture consists of one or more chart areas, which are rectangular areas that are used to draw series, labels, axes, grid lines, tick marks, and so on. Multiple series can be plotted in one chart area, depending on the chart types involved.
The plot area, used to plot chart data, is also contained within a chart area.

Chart Picture
The chart picture, is the entire image surface that is rendered by the Chart control. It corresponds to the root Chart object.  

Chart Series
A series is a related group of data points. Each series is associated with a chart type.

Legend
A legend for the Chart picture. There can be an unlimited number of legends in a chart.

Grid Lines
There are major and minor horizontal and vertical grid lines, which usually occur in conjunction with tick marks.

Tick Marks
There are major and minor horizontal and vertical tick marks, which usually occur in conjunction with grid lines.

Plot Area
The plot area is the inner rectangular area within a chart area that is used to plot series and grid lines. Labels, tick marks, the axis title, and so on, are all drawn outside of the plotting area and inside the chart area. The plot area can be set via the ChartArea.InnerPlotPosition property.

Title
A main chart title. There can be an unlimited number of titles placed in a chart image. Note that custom text can be displayed using GDI+ and the paint-related events.

Value Label
A special label that occurs for a data point, slightly offset from where the point is plotted. It can be the data point's value or custom text.

MS Chart Control: Getting Started

The Main Components of a Chart
The Chart control renders a single "Chart Picture." The Chart Picture may be composed of multiple charts - say, a line chart and a bar chart. Each chart within the Chart Picture is referred to as a Chart Area. (Typically the Chart control will have only one Chart Area.) A chart contains one or more series, which are associated with a particular Chart Area. A series is a collection of data points. How the series is rendered depends on its type. A series configured to display as a line will render its data points as a continuous line. To have multiple lines in the chart you would define one series for each line. If the series is configured to display a bar or column then a bar or column is drawn for each data point.
The data points that make up a series usually have two components - an X value and a Y value - although some series types only require a single data point. For line and column series the X value indicates the position of the data point along the chart area's X axis and the Y value indicates the position of the line or the height of the column along the chart area's Y axis.

This sample chart application demonstrates how to create a basic chart in 2D and 3D that uses a code-behind page with dynamic and datasets.  Here you can find total 7 types of charts.

Using Dynamic Data Creating Charts:
Step 1: .ASPX Page
The chart area(s), series, and data points can be specified declaratively (either by entering the declarative markup by hand or via the Properties window) or programmatically in the code-behind class. Typically the series and chart area(s) are specified declaratively and the data points are populated programmatically by querying a database or some other dynamic data store. Let's start by discussing how to display a chart whose chart area, series, and data points are all specified declaratively.
  1. Column
  2. Bar
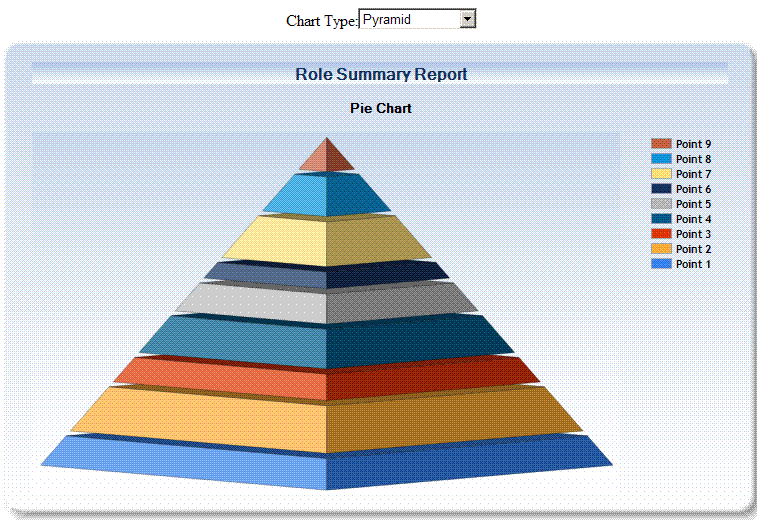
  3. Pyramid 
  4. Area
  5. Pie
  6. Line
  7. Funnel charts

<div>
        <table cellpadding="4">
            <tr>
                <td align="center">
                    Chart Type:<asp:DropDownList ID="ChartType" runat="server" Width="120px" AutoPostBack="True"
                        >
                        <asp:ListItem Value="Column">Column</asp:ListItem>
                        <asp:ListItem Value="Bar">Bar</asp:ListItem>
                        <asp:ListItem Value="Pyramid">Pyramid</asp:ListItem>
                        <asp:ListItem Value="Area">Area</asp:ListItem>
                        <asp:ListItem Value="Pie">Pie</asp:ListItem>
                        <asp:ListItem Value="Line">Line</asp:ListItem>
                        <asp:ListItem Value="Funnel">Funnel</asp:ListItem>
                    </asp:DropDownList>
                </td>
            </tr>
            <tr>
                <td>
                    <asp:Chart ID="Chart1" runat="server" ImageLocation="~/TempImages/ChartPic_#SEQ(300,3)"
                        Palette="BrightPastel" ImageType="Png" BorderDashStyle="Solid" BackSecondaryColor="White"
                        BackGradientStyle="TopBottom" BorderWidth="2" BackColor="#D3DFF0" BorderColor="26, 59, 105"
                        Height="481px" Width="761px">
                        <BorderSkin SkinStyle="Emboss" />
                        <Legends>
                            <asp:Legend Name="Legend1" BackColor="Transparent" Font="Trebuchet MS, 8.25pt, style=Bold"
                                IsTextAutoFit="False">
                            </asp:Legend>
                        </Legends>
                        <Titles>
                            <asp:Title Alignment="TopCenter" BackColor="180, 165, 191, 228" BackGradientStyle="TopBottom"
                                BackHatchStyle="None" Font="Microsoft Sans Serif, 12pt, style=Bold" Name="Role Summary Report"
                                Text="Role Summary Report" ToolTip="Role Summary Report" ForeColor="26, 59, 105">
                            </asp:Title>
                            <asp:Title Alignment="TopCenter" BackColor="Transparent" Font="Microsoft Sans Serif, 10pt, style=Bold "
                                ToolTip="Chart Type">
                            </asp:Title>
                        </Titles>
                        <Series>
                            <asp:Series Name="RolesCount" ChartArea="ChartArea1" Legend="Legend1" CustomProperties="DrawingStyle=Cylinder"
                                BorderColor="64, 0, 0, 0" Color="224, 64, 10" MarkerSize="5">
                                <EmptyPointStyle AxisLabel="0" />
                                <Points>
                                    <asp:DataPoint YValues="6" />
                                    <asp:DataPoint YValues="9" />
                                    <asp:DataPoint YValues="5" />
                                    <asp:DataPoint YValues="7.5" />
                                    <asp:DataPoint YValues="5.69999980926514" />
                                    <asp:DataPoint YValues="3.20000004768372" />
                                    <asp:DataPoint YValues="8.5" />
                                    <asp:DataPoint YValues="7.5" />
                                    <asp:DataPoint YValues="6.5" />
                                </Points>
                            </asp:Series>
                        </Series>
                        <ChartAreas>
                            <asp:ChartArea Name="ChartArea1" BackColor="64, 165, 191, 228" BackSecondaryColor="White"
                                BorderColor="64, 64, 64, 64" ShadowColor="Transparent" BackGradientStyle="TopBottom">
                                <AxisY LineColor="64, 64, 64, 64" IsLabelAutoFit="false" Title="Roles Count" ArrowStyle="Triangle">
                                    <LabelStyle Font="Trebuchet MS, 8.25pt, style=Bold" />
                                    <MajorGrid LineColor="64, 64, 64, 64" />
                                </AxisY>
                                <AxisX IsLabelAutoFit="False" LineColor="64, 64, 64, 64" Title="Role Name" ArrowStyle="Triangle"
                                    Interval="1">
                                    <LabelStyle Font="Trebuchet MS, 8.25pt, style=Bold" IsEndLabelVisible="False" Angle="-90" />
                                    <MajorGrid LineColor="64, 64, 64, 64" />
                                </AxisX>
                            </asp:ChartArea>
                        </ChartAreas>
                    </asp:Chart>
                </td>
            </tr>
        </table>
    </div>

Step 2: .ASPX.CS
Based on the selected chart type the following code will be executed.  
protected void Page_Load(object sender, EventArgs e)
        {
            if (ChartType.SelectedItem.ToString() == "Bar")
            {
                Chart1.Series["RolesCount"].ChartType = SeriesChartType.Bar;
                Chart1.Titles[1].Text = "Bar Chart";
            }
            else if (ChartType.SelectedItem.ToString() == "Pie")
            {
                Chart1.Series["RolesCount"]["3DLabelLineSize"] = "100";
                Chart1.ChartAreas["ChartArea1"].Area3DStyle.Enable3D = false;
                Chart1.ChartAreas["ChartArea1"].Area3DStyle.Inclination = 15;
                Chart1.ChartAreas["ChartArea1"].Area3DStyle.Rotation = 10;
                Chart1.ChartAreas["ChartArea1"].Area3DStyle.Perspective = 10;
                Chart1.ChartAreas["ChartArea1"].Area3DStyle.IsRightAngleAxes = false;
                Chart1.ChartAreas["ChartArea1"].Area3DStyle.WallWidth = 0;
                Chart1.ChartAreas["ChartArea1"].Area3DStyle.IsClustered = false;
                Chart1.Series[0]["PieDrawingStyle"] = "SoftEdge";
                Chart1.Series["RolesCount"].ChartType = SeriesChartType.Pie;
                Chart1.Series["RolesCount"]["PieLabelStyle"] = "Inside";

                //Chart1.Legends["Legend1"].Enabled = true;

                Chart1.Titles[1].Text = "Pie Chart";
            }
            else if (ChartType.SelectedItem.ToString() == "Line")
            {
                Chart1.Series["RolesCount"].ChartType = SeriesChartType.Line;
                Chart1.Titles[1].Text = "Line Chart";
            }
            else if (ChartType.SelectedItem.ToString() == "Funnel")
            {
                //Chart1.Series["RolesCount"]["3DLabelLineSize"] = "100";
                Chart1.Series["RolesCount"]["FunnelStyle"] = "YIsHeight";
                Chart1.Series["RolesCount"]["FunnelLabelStyle"] = "OutsideInColumn";
                Chart1.Series["RolesCount"]["FunnelOutsideLabelPlacement"] = "Right";
                Chart1.Series["RolesCount"]["FunnelPointGap"] = "1";
                Chart1.Series["RolesCount"]["Funnel3DDrawingStyle"] = "SoftEdge";
                Chart1.Series["RolesCount"].ChartType = SeriesChartType.Funnel;
                Chart1.Series["RolesCount"]["FunnelLabelStyle"] = "Inside";
                // Set 3D angle
                Chart1.Series["RolesCount"]["Funnel3DRotationAngle"] = "5";
                // Set 3D drawing style
                Chart1.Series["RolesCount"]["Funnel3DDrawingStyle"] = "CircularBase";
                // Set minimum point height
                Chart1.Series["RolesCount"]["FunnelMinPointHeight"] = "0";
                Chart1.ChartAreas["ChartArea1"].Area3DStyle.Enable3D = true;
                Chart1.ChartAreas["ChartArea1"].Area3DStyle.Inclination = 15;
                Chart1.ChartAreas["ChartArea1"].Area3DStyle.Rotation = 10;
                Chart1.ChartAreas["ChartArea1"].Area3DStyle.Perspective = 10;
                Chart1.ChartAreas["ChartArea1"].Area3DStyle.IsRightAngleAxes = false;
                Chart1.ChartAreas["ChartArea1"].Area3DStyle.WallWidth = 0;
                Chart1.ChartAreas["ChartArea1"].Area3DStyle.IsClustered = false;
                Chart1.Titles[1].Text = "Funnel Chart";
            }
            else if (ChartType.SelectedItem.ToString() == "Area")
            {

                Chart1.ChartAreas["ChartArea1"].Area3DStyle.Enable3D = true;

                Chart1.Series["RolesCount"].ChartType = SeriesChartType.Area;
                Chart1.Titles[1].Text = "Area Chart";
            }
            else if (ChartType.SelectedItem.ToString() == "Pyramid")
            {
                // Set pyramid data point labels style
                Chart1.Series["RolesCount"]["PyramidLabelStyle"] = "OutsideInColumn";
                // Set gap between points
                Chart1.Series["RolesCount"]["PyramidPointGap"] = "1";
                // Set minimum point height
                Chart1.Series["RolesCount"]["PyramidMinPointHeight"] = "0";
                // Set 3D mode
                Chart1.ChartAreas["ChartArea1"].Area3DStyle.Enable3D = true;
                // Set 3D angle
                Chart1.Series["RolesCount"]["Pyramid3DRotationAngle"] = "5";
                // Set 3D drawing style
                Chart1.Series["RolesCount"]["Pyramid3DDrawingStyle"] = "SquareBase";
                // Set pyramid value type
                Chart1.Series["RolesCount"]["PyramidValueType"] = "Linear";
                Chart1.Series["RolesCount"].ChartType = SeriesChartType.Pyramid;
                Chart1.Titles[1].Text = "Pie Chart";
            }
            else
            {
                Chart1.Series["RolesCount"].ChartType = SeriesChartType.Column;
                Chart1.Titles[1].Text = "Column Chart";
            }
        }
Using DataSource Controls Creating Charts:

Programmatically Specifying the Chart Data
The previous demo showed how to declaratively specify the chart's data points. These data points are more commonly specified programmatically. The demo displays the same chart as shown above but adds the data points programmatically in the Page_Load event handler. The Chart control's declarative markup in .aspx does not include the hard-coded <Points> collection, but is otherwise the same in that the markup defines a single chart area named MainChartArea and a single column series named Championships:


<div>
        <table cellpadding="4">
            <tr>
                <td valign="top" align="center">
                    Chart Type:
                    <asp:DropDownList ID="ChartType" runat="server" Width="120px" AutoPostBack="True">
                        <asp:ListItem Value="Column">Column</asp:ListItem>
                        <asp:ListItem Value="Bar">Bar</asp:ListItem>
                        <asp:ListItem Value="Pyramid">Pyramid</asp:ListItem>
                        <asp:ListItem Value="Area">Area</asp:ListItem>
                        <asp:ListItem Value="Pie">Pie</asp:ListItem>
                        <asp:ListItem Value="Line">Line</asp:ListItem>
                        <asp:ListItem Value="Funnel">Funnel</asp:ListItem>
                    </asp:DropDownList>
                </td>
            </tr>
            <tr>
                <td colspan="2">
                    <asp:Chart ID="Chart1" runat="server" ImageLocation="~/TempImages/ChartPic_#SEQ(300,3)"
                        Palette="BrightPastel" ImageType="Png" BorderDashStyle="Solid" BackSecondaryColor="White"
                        BackGradientStyle="TopBottom" BorderWidth="2" BackColor="#D3DFF0" BorderColor="26, 59, 105"
                        Height="481px" Width="761px">
                        <BorderSkin SkinStyle="Emboss" />
                        <Legends>
                            <asp:Legend Name="Legend1" BackColor="Transparent" Font="Trebuchet MS, 8.25pt, style=Bold"
                                IsTextAutoFit="False">
                            </asp:Legend>
                        </Legends>
                        <Titles>
                            <asp:Title Alignment="TopCenter" BackColor="180, 165, 191, 228" BackGradientStyle="TopBottom"
                                BackHatchStyle="None" Font="Microsoft Sans Serif, 12pt, style=Bold" Name="Employee Data Dump"
                                Text="Employee Data Dump" ToolTip="Employee Data Dump" ForeColor="26, 59, 105">
                            </asp:Title>
                            <asp:Title Alignment="TopCenter" BackColor="Transparent" Font="Microsoft Sans Serif, 10pt, style=Bold "
                                ToolTip="Chart Type">
                            </asp:Title>
                        </Titles>
                        <Series>
                            <asp:Series Name="EmpCount" ChartArea="ChartArea1" Legend="Legend1" CustomProperties="DrawingStyle=Cylinder"
                                BorderColor="64, 0, 0, 0" Color="224, 64, 10" MarkerSize="5">
                                <EmptyPointStyle AxisLabel="0" />
                            </asp:Series>
                        </Series>
                        <ChartAreas>
                            <asp:ChartArea Name="ChartArea1" BackColor="64, 165, 191, 228" BackSecondaryColor="White"
                                BorderColor="64, 64, 64, 64" ShadowColor="Transparent" BackGradientStyle="TopBottom">
                                <AxisY LineColor="64, 64, 64, 64" IsLabelAutoFit="False" Title="Employee Count" ArrowStyle="Triangle">
                                    <LabelStyle Font="Trebuchet MS, 8.25pt, style=Bold" />
                                    <MajorGrid LineColor="64, 64, 64, 64" />
                                </AxisY>
                                <AxisX IsLabelAutoFit="False" LineColor="64, 64, 64, 64" Title="Facility" ArrowStyle="Triangle"
                                    Interval="1">
                                    <LabelStyle Font="Trebuchet MS, 8.25pt, style=Bold" IsEndLabelVisible="False" Angle="0" />
                                    <MajorGrid LineColor="64, 64, 64, 64" />
                                </AxisX>
                            </asp:ChartArea>
                        </ChartAreas>
                    </asp:Chart>
                </td>
            </tr>
        </table>
    </div>

Code Behind :
Alternatively, you can bind data by using the Chart control's DataSource property. This involves retrieving the data from the database (or from wherever you get the data to display), assigning it to the DataSource property, and calling the Chart's DataBind method. Unlike with the DataBindTable method, when using the DataSource property you need to define a series and specify the name of the properties in the data that are to be displayed in the X and Y values in the series.  

SqlConnection con=new SqlConnection(ConfigurationManager.ConnectionStrings["Connection"].ConnectionString);
    SqlConnection con = new SqlConnection(new ConnectionString().getConnectionString());
    SqlDataAdapter da = new SqlDataAdapter();
    DataSet ds = new DataSet();
da = new SqlDataAdapter("exec StoredProcedure", con);
        da.Fill(ds, "EmpDataDump");
        if (ds.Tables["EmpDataDump"].Rows.Count > 0)
        {
Chart1.DataSource = ds.Tables["EmpDataDump"];

        // Set series members names for the X and Y values
        Chart1.Series["EmpCount"].XValueMember = "City";
        Chart1.Series["EmpCount"].YValueMembers = "EmpCount";
        Chart1.Series["EmpCount"].IsValueShownAsLabel = true;


        if (ChartType.SelectedItem.ToString() == "Bar")
        {
            Chart1.Series["EmpCount"].ChartType = SeriesChartType.Bar;
            Chart1.Titles[1].Text = "Bar Chart";
        }
        else if (ChartType.SelectedItem.ToString() == "Pie")
        {
            Chart1.Series["EmpCount"]["3DLabelLineSize"] = "100";
            Chart1.ChartAreas["ChartArea1"].Area3DStyle.Enable3D = false;
            Chart1.ChartAreas["ChartArea1"].Area3DStyle.Inclination = 15;
            Chart1.ChartAreas["ChartArea1"].Area3DStyle.Rotation = 10;
            Chart1.ChartAreas["ChartArea1"].Area3DStyle.Perspective = 10;
            Chart1.ChartAreas["ChartArea1"].Area3DStyle.IsRightAngleAxes = false;
            Chart1.ChartAreas["ChartArea1"].Area3DStyle.WallWidth = 0;
            Chart1.ChartAreas["ChartArea1"].Area3DStyle.IsClustered = false;
            Chart1.Series[0]["PieDrawingStyle"] = "SoftEdge";
            Chart1.Series["EmpCount"].ChartType = SeriesChartType.Pie;
            Chart1.Series["EmpCount"]["PieLabelStyle"] = "OutsideInColumn";
            Chart1.Series["EmpCount"]["PieOutsideLabelPlacement"] = "Right";
            Chart1.Titles[1].Text = "Pie Chart";
        }
        else if (ChartType.SelectedItem.ToString() == "Line")
        {
            Chart1.Series["EmpCount"].ChartType = SeriesChartType.Line;
            Chart1.Titles[1].Text = "Line Chart";
        }
        else if (ChartType.SelectedItem.ToString() == "Funnel")
        {
            Chart1.Series["EmpCount"]["FunnelStyle"] = "YIsHeight";
            Chart1.Series["EmpCount"]["FunnelLabelStyle"] = "OutsideInColumn";
            Chart1.Series["EmpCount"]["FunnelOutsideLabelPlacement"] = "Right";
            Chart1.Series["EmpCount"]["FunnelPointGap"] = "1";
            Chart1.Series["EmpCount"]["Funnel3DDrawingStyle"] = "SoftEdge";
            Chart1.Series["EmpCount"].ChartType = SeriesChartType.Funnel;
            Chart1.Series["EmpCount"]["Funnel3DRotationAngle"] = "5";
            Chart1.Series["EmpCount"]["Funnel3DDrawingStyle"] = "CircularBase";
            Chart1.Series["EmpCount"]["FunnelMinPointHeight"] = "0";
            Chart1.ChartAreas["ChartArea1"].Area3DStyle.Enable3D = true;
            Chart1.ChartAreas["ChartArea1"].Area3DStyle.Inclination = 15;
            Chart1.ChartAreas["ChartArea1"].Area3DStyle.Rotation = 10;
            Chart1.ChartAreas["ChartArea1"].Area3DStyle.Perspective = 10;
            Chart1.ChartAreas["ChartArea1"].Area3DStyle.IsRightAngleAxes = false;
            Chart1.ChartAreas["ChartArea1"].Area3DStyle.WallWidth = 0;
            Chart1.ChartAreas["ChartArea1"].Area3DStyle.IsClustered = false;
            Chart1.Titles[1].Text = "Funnel Chart";
        }
        else if (ChartType.SelectedItem.ToString() == "Area")
        {
            Chart1.Series["EmpCount"].ChartType = SeriesChartType.Area;
            Chart1.Titles[1].Text = "Area Chart";
        }
        else if (ChartType.SelectedItem.ToString() == "Pyramid")
        {
            Chart1.Series["EmpCount"]["PyramidLabelStyle"] = "OutsideInColumn";
            Chart1.Series["EmpCount"]["PyramidPointGap"] = "1";
            Chart1.Series["EmpCount"]["PyramidMinPointHeight"] = "0";
            Chart1.ChartAreas["ChartArea1"].Area3DStyle.Enable3D = true;
            Chart1.Series["EmpCount"]["Pyramid3DRotationAngle"] = "5";
            Chart1.Series["EmpCount"]["Pyramid3DDrawingStyle"] = "SquareBase";
            Chart1.Series["EmpCount"]["PyramidValueType"] = "Linear";
            Chart1.Series["EmpCount"].ChartType = SeriesChartType.Pyramid;
            Chart1.Titles[1].Text = "Pyramid Chart";
        }
        else
        {
            Chart1.Series["EmpCount"].ChartType = SeriesChartType.Column;
            Chart1.Titles[1].Text = "Column Chart";
        }
        // Data bind to the selected data source
        Chart1.DataBind();
         }

The resulting chart, when viewed through a browser, is shown below.
Column Chart:

Bar Chart:
Pyramid: (3D Chart)


Area:(3D Chart)

Pie:(3D Chart)

Line:

Funnel:(3D Chart)


03 February 2012

Deploying Microsoft Chart Controls

MSChart.exe setup should be used to deploy Microsoft Chart controls but what exactly need to be done to create a deployment package in Visual Studio? Visual Studio provides an easy way to add the prerequisites using bootstrappers. Now we have a detailed instructions on how to create and use .NET Chart Control bootstrapper.

Adding MS Chart Controls as a prerequisite in your Visual Studio 2008 installation package.
In order to specify a prerequisite to your deployment package something called a bootstrapper is needed. Unfortunately Microsoft do not provide a bootstrapper for the Chart Controls for the .Net Framework. Luckily it is not too difficult to create your own bootstrapper.

Here's how to do it:
Firstly you need to locate the folder in which the bootstrapper files need to be. On my machine this is here: C:\Program Files\Microsoft SDKs\Windows\v6.0A\Bootstrapper\Packages\

Follow the instructions below to create the files:
  1. Create a Folder called: Microsoft Chart Controls
  2. In this new folder create a file called product.xml
  3. Use Notepad to edit this file and add the following code:
    <?xml version="1.0" encoding="utf-8" ?> 
    <!-- Bootstrapper for MS Chart Controls. Created by Phil Preen, Feb 2009,
    use at your own risk -->
    <Product xmlns="http://schemas.microsoft.com/developer/2004/01/bootstrapper" 
    ProductCode="Microsoft.ChartControls">
    <RelatedProducts>
    <DependsOnProduct Code="Microsoft.Net.Framework.3.5.SP1" /> 
    </RelatedProducts>
    <PackageFiles CopyAllPackageFiles="false">
    <PackageFile Name="MSChart.exe" HomeSite="MSChart.exe" /> 
    </PackageFiles>
    <InstallChecks /> 
    <Commands>
    <Command PackageFile="MSChart.exe">
    <ExitCodes>
    <DefaultExitCode Result="Success" /> 
    </ExitCodes>
    </Command>
    </Commands>
    </Product>
  4. Copy MSChart.exe (the chart controls installation package) into this folder.
  5. Create a sub-folder called: en
  6. In this new folder create a file called package.xml
  7. Use Notepad to edit this file and add the following code:
    <?xml version="1.0" encoding="utf-8" ?>
    <!-- Bootstrapper for MS Chart Controls. Created by Phil Preen, Feb 2009, 
    use at your own risk -->
    <Package
      xmlns="http://schemas.microsoft.com/developer/2004/01/bootstrapper"
      Name="DisplayName"
      Culture="Culture"
      LicenseAgreement="eula.rtf"
    >
        <PackageFiles>
            <PackageFile Name="eula.rtf"/>
        </PackageFiles>
        <!-- Defines a localizable string table for error messages-->
        <Strings>
            <String Name="DisplayName">Microsoft Chart Controls for Dotnet 
    Framework 3.5 SP1</String>
            <String Name="Culture">en</String>
            <String Name="AdminRequired">Administrator permissions are 
    required to install
    Microsoft Chart Controls for Dotnet Framework 3.5 SP1. Contact your 
    administrator.</String>
            <String Name="AnotherInstanceRunning">Another instance of setup is
    already running. The running instance must complete before this setup can 
    proceed.</String>
            <String Name="GeneralFailure">A failure occurred attempting to 
    install Microsoft Chart Controls for Dotnet Framework 3.5 SP1.</String>
        </Strings>
    </Package>
  8. Copy eula.rtf (the chart controls license agreement) into this folder. To obtain this file, start the Chart Controls installer and choose the option to Save the license agreement.
 Microsoft Chart Controls will now appear in the list of prerequisites in your Visual Studio deployment settings.

 Note that because Microsoft Chart Controls is dependent upon the .Net Framework 3.5 SP1. It is necessary to have the Framework files available.

Reference Link : View

01 February 2012

ASP.NET 3.5 Chart Control

Microsoft recently released a cool new ASP.NET server control - <asp:chart /> - that can be used for free with ASP.NET 3.5 to enable rich browser-based charting scenarios:

Important download links:
Samples to get your development started are available on MSDN (http://code.msdn.microsoft.com/mschart).  Furthermore, if you have questions or suggestions, or just want to share your excitement, please visit our newly created MSDN forum for Windows Forms and ASP.NET Chart Controls.

<asp:chart /> supports a rich assortment of chart options - including pie, area, range, point, circular, accumulation, data distribution, ajax interactive, doughnut, and more. You can statically declare chart data within the control declaration, or alternatively use data-binding to populate it dynamically. At runtime the server control generates an image (for example a .PNG file) that is referenced from the client HTML of the page using a <img/> element output by the <asp:chart/> control. The server control supports the ability to cache the chart image, as well as save it on disk for persistent scenarios. It does not require any other server software to be installed, and will work with any standard ASP.NET page.

Implement the Control Into Your Page
Once installed the <asp:chart/> control shows up under the "Data" tab on the Toolbox, and can be easily declared on any ASP.NET page as a standard server control: but if you are using Visual Web Developer Express, you will need to add it manually. This can be done by right-clicking on the Data section header, and choosing Add Items. as show below.
From there, select the System.Web.UI.DataVisualization.Charting flavour of Chart, and click OK.
That's it. The Chart icon should appear in your toolbox, ready to be dragged onto the Forms Designer. Once you do, you are presented with a default vertical bar chart.

If you drag the chart control into the design-surface, Visual Studio adds some settings to the web.config. This will be done automatically so the following is just an explanation of the changes:

Web.config Changes
 

1)  ChartImage Settings
At the node <appSettings>, the following entry will be created:

<add key="ChartImageHandler" value="storage=file;timeout=20;dir=c:\TempImageFiles\;" />
This is the configuration of the temporary storage, where the generated files should be placed at. Please be aware of the fact that the storage will use a large amount of space, depending on how many charts
will be generated.
2)  ChartImage.axd Handler
At <system.web><httpHandlers>, the following entry will be added:

<add path="ChartImg.axd" verb="GET,HEAD,POST" type="System.Web.UI.DataVisualization.Charting.ChartHttpHandler, System.Web.DataVisualization, Version=4.0.0.0, Culture=neutral,PublicKeyToken=31bf3856ad364e35" validate="false" />

The chartimage.axd is the main-component of the chart-control. The handler will be called for each generated image.
3)  Control-definition
In the node <system.web><pages><controls>, the tag-definition will be added:

<add tagPrefix="asp" namespace="System.Web.UI.DataVisualization.Charting" assembly="System.Web.DataVisualization, Version=4.0.0.0, Culture:neutral, PublicKeyToken=31bf3856ad364e35" />

This will add the tag-support, that we can use a <asp:chart /> tag in our aspx pages.
4)  Reference to the DataVisualization Assembly
At the end, a reference to the DataVisualization assembly will be added at <system.web><compilation><assemblies>:
<add assembly="System.Web.DataVisualization, Version=4.0.0.0, Culture:neutral, PublicKeyToken=31bf3856ad364e35"/>

Default Chart-element in aspx Page
In the aspx page, where you dragged the control in, Visual Studio will add the default chart-control to the code:
<asp:Chart ID="Chart1" runat="server"> 
         <Series> 
                  <asp:Series Name="Series1"></asp:Series> 
         </Series>
         <ChartAreas>
                 <asp:ChartArea Name="ChartArea1"> </asp:ChartArea> 
         </ChartAreas> 
</asp:Chart>

Charting Quickstart
Before we begin using the chart control, I would like to explain the properties "Series" and "ChartAreas":

Series :
The Series collection contains the data-points for one or more data-series. Basically for each line in the chart (consisting of multiple data-points), one series of data is required.
Each series can have its own ChartType. Additionally, each series can be assigned to any ChartArea where each series can also have its own rendering-properties (for example colors, labels, etc.).

ChartAreas :
The ChartArea collection can have one or more configurations which controls the rendering of a chart.
Important: There must be at least one ChartArea definition that the rendering will be executed!

Now we know that we have to add a <asp:Series> in the property <series><asp:ChartArea> at the <ChartAreas> defined, otherwise we would get just a white picture. which contains our datapoints. Also we have to be sure that there is at least one
After changing the chart-control code to the following:

<asp:Chart ID="cTestChart" runat="server">
         <Series>
                 <asp:Series Name="Testing" YValueType="Int32">
                           <Points> 
                                  <asp:DataPoint AxisLabel="Test 1" YValues="10" /> 
                                  <asp:DataPoint AxisLabel="Test 2" YValues="20" /> 
                                 <asp:DataPoint AxisLabel="Test 3" YValues="30" />
                                 <asp:DataPoint AxisLabel="Test 4" YValues="40" /> 
                         </Points> 
               </asp:Series>
          </Series>
         <ChartAreas> 
               <asp:ChartArea Name="ChartArea1">  </asp:ChartArea> 
        </ChartAreas> 
</asp:Chart>

We will get this output in the rendered output page:

So we successfully created our first chart!


Deploying MS Chart Controls:(Production Server)
"MSChart.exe" setup should be used to deploy Microsoft Chart controls and
Changes needed  in the web.config as shown below.

From

<add key="ChartImageHandler" value="storage=file;timeout=20;dir=c:\TempImageFiles\;" />
To
<add key="ChartImageHandler" value="storage=file;timeout=20;" />

Reference Links : http://www.4guysfromrolla.com/articles/072209-1.aspx